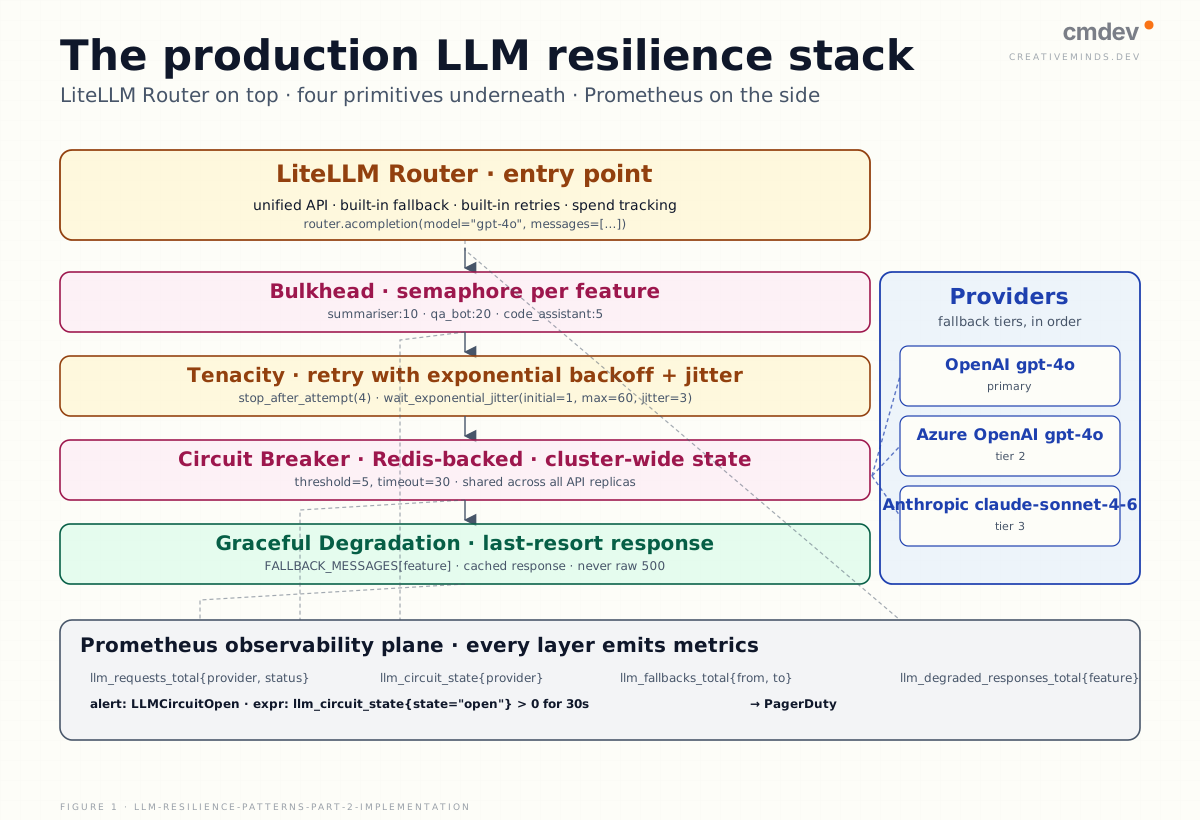
Six weeks after the 03:47 Tuesday page in Part 1, the same Berlin AI-native SaaS runs its first architecture review of what they built. LiteLLM Router is now the entry point for every LLM call in the platform, with Anthropic and Azure OpenAI configured as fallback tiers. A Redis-backed circuit breaker sits underneath, shared across all API replicas. Tenacity handles retries with jitter. A semaphore-per-feature bulkhead isolates the noisy document-summariser from the always-on chatbot. Prometheus scrapes the metrics; PagerDuty pages when any circuit stays OPEN longer than thirty seconds. The last provider outage lasted eighteen minutes and produced zero user tickets.
Part 1 was the design register — what the six patterns are and when to reach for each. Part 2 is the implementation register — the tools, the code contracts, the alert thresholds that actually fire, and the six mistakes that turn the resilience stack into resilience theatre. This is the piece the platform engineer opens on the Monday morning after the design decision has been made.
Key takeaways
- LiteLLM Router is a drop-in replacement for the OpenAI client with built-in fallback, retries, and unified API across 100+ providers. It handles the common resilience path with almost no code changes. It does not handle bulkhead isolation, cluster-wide circuit breaker state, or feature-specific degradation messages — those still need code.
- The Redis-backed circuit breaker is the load-bearing primitive underneath LiteLLM's router-level retries. Without shared state, each pod holds its own breaker and the failing provider keeps getting hit from every other pod that has not opened yet.
- Tenacity handles retries with exponential backoff and jitter in about eight lines of Python. Do not retry on errors that will never succeed — AuthenticationError, ContentFilterError, InvalidRequestError.
- Prometheus counters and gauges for circuit state, fallback rate, and degradation rate cost almost nothing to instrument. The alert on circuit-OPEN-for-30-seconds fires before the user tickets arrive; the alert on degradation-rate-exceeds-5%-for-2-minutes is the second-order signal that catches slow provider degradation.
- The six anti-patterns from the source community carousel — in-process breaker state only, retrying auth errors, fixed retry delays, no bulkhead between features, raw stack traces returned to users, no metrics on fallback rate — turn resilience stacks into resilience theatre. Each is common enough that most teams have shipped at least three.
LiteLLM Router — The Honest Read
LiteLLM Router is the fastest path to a working fallback chain. The configuration is roughly ten lines of Python — a model list with model_name and litellm_params for each provider, a fallbacks map linking each primary to its fallback, num_retries, and retry_after. From that point, router.acompletion(model="gpt-4o", messages=[...]) handles the retry, the fallback to Azure OpenAI or Anthropic, and the unified API across every provider on the model list.
What it gives you — a drop-in replacement for the OpenAI client, built-in fallback across providers, built-in retries with configurable backoff, unified API across more than a hundred providers including Bedrock and Vertex, built-in spend tracking. Zero code changes when switching providers. For most applications, that covers the common resilience path.
What it does not give you — cluster-wide circuit-breaker state (LiteLLM's own retry logic is per-process; a real breaker still needs Redis), feature-specific bulkhead isolation (the router does not know that your summariser and your chatbot should have different concurrency ceilings), per-feature graceful-degradation content (the router will return an error when everything fails; the friendly fallback message still needs code), and observability at the granularity the SRE actually needs (LiteLLM emits some metrics; the Prometheus counters that alert on circuit-OPEN state require your own instrumentation).
The right posture is to use LiteLLM Router as the entry point and add the four capabilities it does not carry on top of it. Do not build a bespoke router as an alternative — the maintenance cost is real, and you would end up with something LiteLLM already ships.
The Redis-Backed Circuit Breaker Underneath
The circuit breaker holds three pieces of state per provider — a state key (CLOSED / OPEN / HALF-OPEN), a failure counter with a rolling window, and a recovery timeout. Redis-backed means all three live in Redis, not in process memory. The full implementation is short.
import redis, time

r = redis.Redis()

class CircuitBreaker:
    def __init__(self, name, threshold=5, timeout=30):
        self.name = name
        self.threshold = threshold
        self.timeout = timeout

    def _state_key(self): return f"cb:{self.name}:state"
    def _fail_key(self):  return f"cb:{self.name}:failures"

    def is_open(self) -> bool:
        state = r.get(self._state_key())
        return state == b"OPEN"

    def record_failure(self):
        count = r.incr(self._fail_key())
        r.expire(self._fail_key(), 60)
        if count >= self.threshold:
            r.set(self._state_key(), "OPEN", ex=self.timeout)

    def record_success(self):
        r.delete(self._state_key(), self._fail_key())
The reason Redis matters is straightforward — if you run five API pods behind a load balancer and one pod's breaker opens on the failing provider, the other four keep sending traffic to the failing provider until their own breakers open independently. Redis makes the breaker cluster-wide, and the failing provider gets zero traffic from the moment the first pod opens the breaker. This is the single biggest reason the six-pattern list separates the circuit-breaker pattern from LiteLLM's built-in retries.
Tenacity and Bulkhead — Retries and Isolation
Tenacity handles the exponential backoff with jitter in eight lines of Python. The decorator does the rest.
from tenacity import (retry, stop_after_attempt,
                     wait_exponential_jitter, retry_if_exception_type)
from openai import RateLimitError, APIConnectionError

@retry(
    stop=stop_after_attempt(4),
    wait=wait_exponential_jitter(initial=1, max=60, jitter=3),
    retry=retry_if_exception_type((RateLimitError, APIConnectionError)),
    reraise=True,
)
async def call_with_retry(messages: list, model: str) -> str:
    resp = await client.chat.completions.create(model=model, messages=messages)
    return resp.choices[0].message.content
The important detail is the retry_if_exception_type filter — retry on transient errors (rate limit, connection reset, timeout) and do not retry on errors that will never succeed on retry (AuthenticationError, ContentFilterError, InvalidRequestError). The single line of exception-class filtering is what separates a smart retry from a blind retry storm.
Bulkheads live one layer above. The pattern is a semaphore per feature — the summariser gets ten concurrent slots, the QA bot gets twenty, the code assistant gets five. When one feature spikes, its own semaphore fills; the other features keep their slots. In asyncio, the pattern is roughly ten lines — a BulkheadedLLMPool class that holds a dict of asyncio.Semaphore instances, one per feature, and a call method that acquires the appropriate semaphore before invoking call_with_retry. The concurrency ceilings should be picked based on real traffic patterns; a whiteboard number will be wrong on the first traffic spike.
Observability That Actually Fires
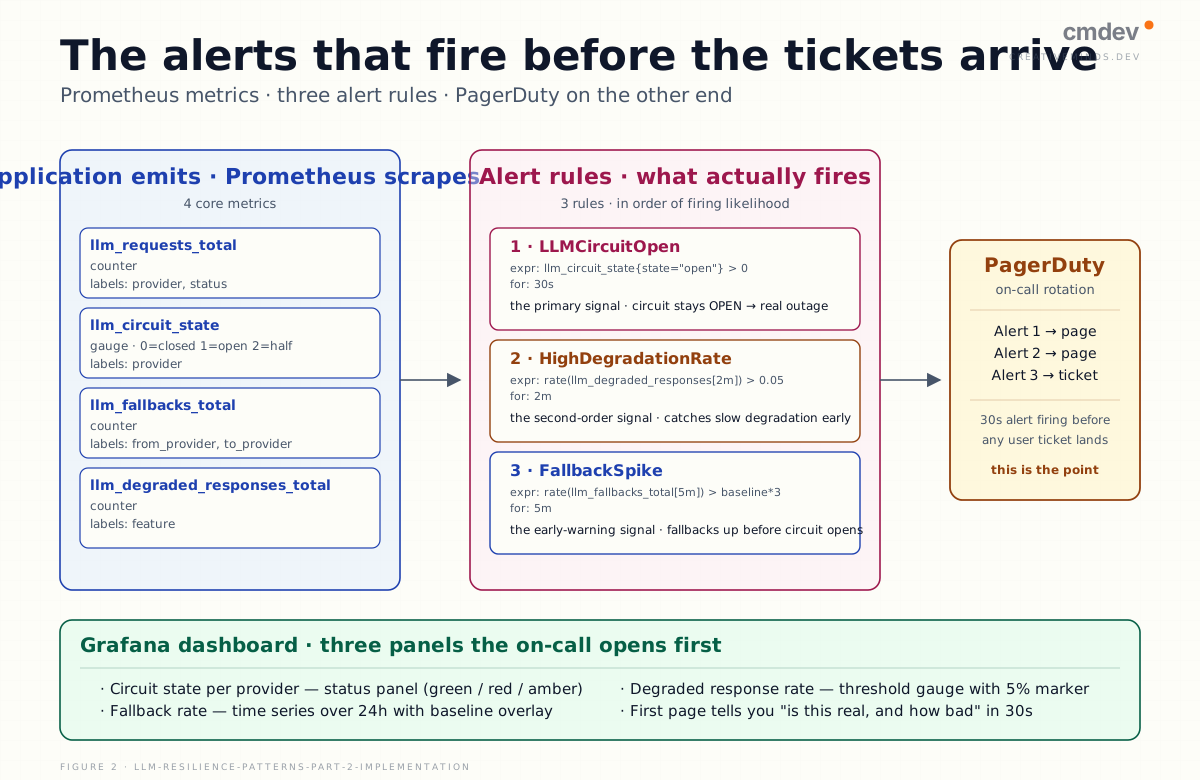
Prometheus counters, gauges, and histograms cover the core surface. Four metrics are enough for most teams to start.
llm_requests_total— counter by provider and statusllm_circuit_state— gauge, 0=CLOSED, 1=OPEN, 2=HALF-OPEN, per providerllm_fallbacks_total— counter by from-provider and to-providerllm_degraded_responses_total— counter by feature
The three alert rules that actually fire first — LLMCircuitOpen on llm_circuit_state{state="open"} > 0 for 30s (the primary signal), HighDegradationRate on rate(llm_degraded_responses_total[2m]) > 0.05 (the second-order signal that catches slow provider degradation before it turns into a full outage), and FallbackSpike on the fallback counter rate exceeding baseline by 3x over 5 minutes (the early-warning signal that one of your providers is degrading before the circuit opens).
The dashboard that pairs with the alerts — circuit state per provider as a status panel, fallback rate as a time series, degraded response rate as a threshold gauge. These three panels give the on-call SRE the answer to is this a real outage, and how bad within thirty seconds of the page.
Six Anti-Patterns to Not Ship
The community carousel that inspired this series called out six mistakes explicitly. All six are common enough that most teams have shipped at least three.
- In-process circuit-breaker state only. Each pod holds its own breaker; the failing provider keeps getting hit from every pod that has not opened yet. Redis is the fix.
- Retrying on errors that will never succeed. AuthenticationError, ContentFilterError, InvalidRequestError. Retrying these wastes budget, slows the failure signal, and can trip rate-limit ceilings that were otherwise fine.
- Fixed retry delay instead of exponential backoff. If 100 clients all retry at t+1s, the provider gets hit by 100 at once again. Jitter and exponential backoff spread the load.
- No bulkhead between features. One feature with a traffic spike blocks every other feature from getting concurrency slots. Each feature needs its own semaphore.
- Raw exception stack trace returned to users. Users should see a friendly degradation message. Log the full trace internally; never expose it externally.
- No metrics on fallback rate. Without tracking how often fallbacks trigger, you cannot detect a provider degrading gradually — the outage that starts at 03:47 tonight was probably visible in the fallback-rate metric an hour before, if the metric existed.
The pattern across all six is the same. Each anti-pattern is a shortcut that saves time on the design day and costs time on the outage day, with the exchange rate heavily against you.
If your platform ships the resilience stack from Part 1 with one of the six anti-patterns above baked in, which of them would show up in your next post-incident review — and how much of the post-mortem would be the honest sentence that it was in the design from day one?
FAQs
Should we standardise on LiteLLM Router, or run the four sub-primitives directly?
Standardise on LiteLLM Router as the entry point. Run the four sub-primitives underneath. The router covers the common resilience path — fallback, retries, unified API — that would otherwise be a maintenance tax on your platform team. The primitives — Redis circuit breaker, Tenacity retry with jitter, semaphore-per-feature bulkhead, per-feature degradation content — cover the things LiteLLM does not, and running them beneath the router is cleaner than running them beside it.
What Prometheus alert thresholds are we most likely to tune incorrectly?
The circuit-OPEN threshold is where the tuning attention should go. Too short and you page on every transient hiccup; too long and the real outage runs unpaged for minutes. Thirty seconds is the common starting point. The degradation-rate threshold (5% for 2 minutes) is usually correct as-is; the fallback-rate 3x threshold needs baseline calibration against your specific traffic pattern before it is trustworthy.
How do we decide the per-feature bulkhead concurrency limits?
Measure the peak concurrent LLM calls per feature over the last 30 days. Set the limit at roughly 2x that peak. If a feature has meaningful bursty traffic — an on-hour spike, a weekly report generation — set the limit at 1.5x the burst peak, not the average. Revisit quarterly. The mistake to avoid is picking whiteboard numbers based on head-count or team size rather than traffic; those numbers are wrong by an order of magnitude in either direction.
Is Bedrock enough of a fallback tier on its own, or do we need Anthropic and Azure OpenAI too?
Bedrock gives you Anthropic, Meta, Mistral, Cohere, and Amazon Titan under one AWS-native surface. For most workloads, Bedrock plus one non-Bedrock primary (OpenAI or Azure OpenAI) is a strong two-tier fallback. Adding a third tier (Anthropic direct or Google Vertex) starts to earn its place at multi-billion-token volume where any single provider having a bad hour is measurable in dollars per minute. Below that scale, the operational tax of a three-tier chain often outweighs the marginal reliability gain.
Companion content
- LLM Resilience Patterns, Part 1: Design — the six patterns, when to reach for each, and the minimum viable stack
- Governing the Agent — Part 3 — the observability and evals discipline this piece sits inside
- OPA for AI Agent Action Approval — the policy-layer pattern that runs alongside the resilience stack
- Hardened Containers for AI Workloads: The Tier Decision — the isolation-tier choice underneath the LLM pool
How to engage
If your on-call rotation is answering the same provider-outage page every quarter and you would rather ship the resilience stack once and stop, talk to us at creativeminds.dev/contact. The cmdev implementation diagnostic reviews your existing LLM stack, names the smallest set of changes that removes the recurring page, and produces the Prometheus alert rules and Grafana dashboards mapped to your SLA.